Home
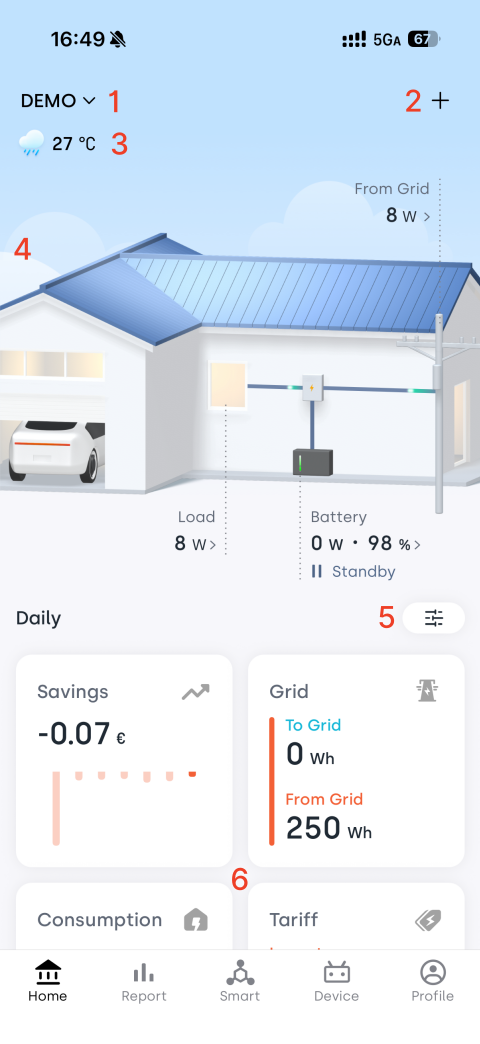
The Home page is your main dashboard for viewing and managing household energy data. Here, you can monitor solar generation, energy consumption, battery charging and discharging, as well as grid import and export in real time. The energy flow diagram provides a clear visual overview of how energy moves throughout your home.
| No. | Feature | Description |
|---|---|---|
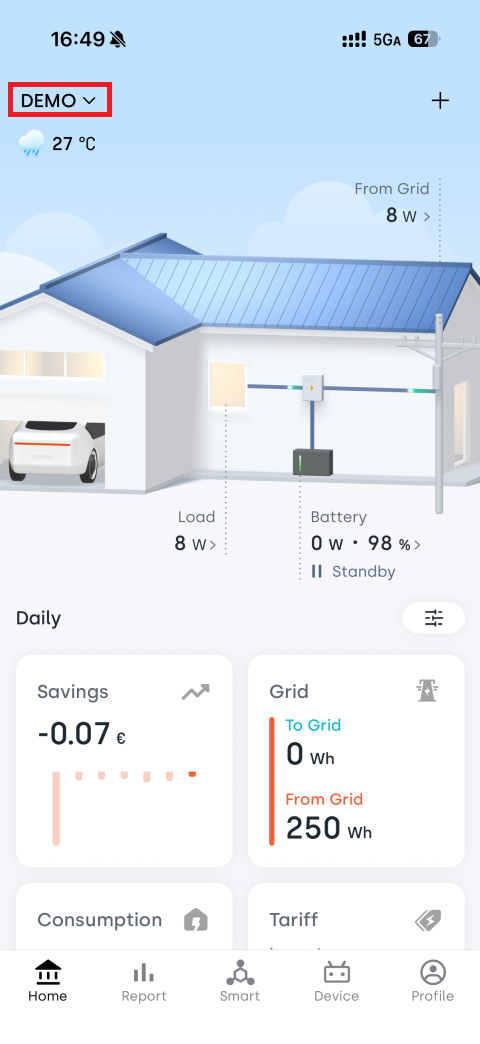
| 1 | Home | Displays the current home name. Tap to view, switch between, or manage all homes associated with your account. |
| 2 | + | Add a device. |
| 3 | Weather | View the current weather conditions and temperature at your home's location. |
| 4 | Power Flow | Dynamically visualizes energy sources and destinations within your home. |
| 5 | Dashboard | Customize the energy flow theme and displayed data metrics. |
| 6 | Daily Data | View daily statistics for generation, consumption, and earnings. |
1. Home
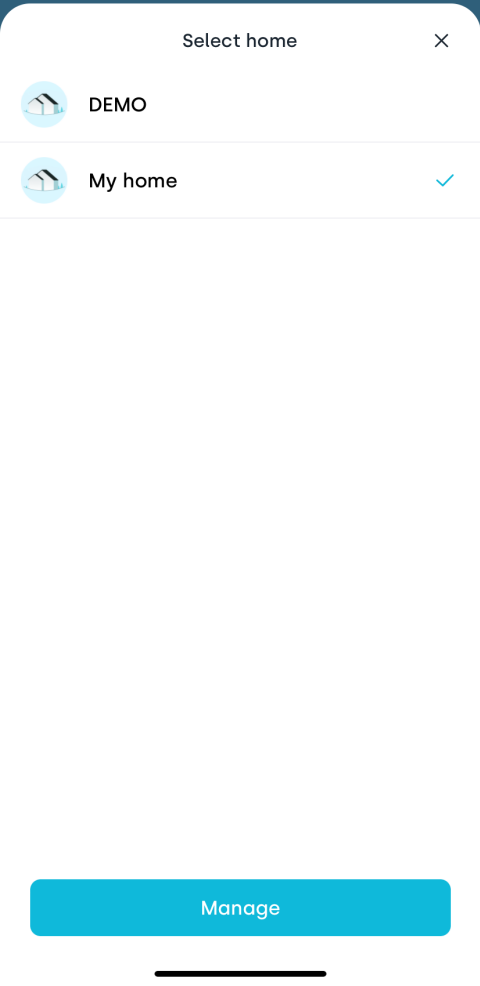
If your account manages multiple homes, you can switch between them at any time to view their energy data.
1.1 Switch Homes
Tap the home name in the upper-left corner to view all homes associated with your account.
Select a home to switch to its energy overview.
1.2 Manage Homes
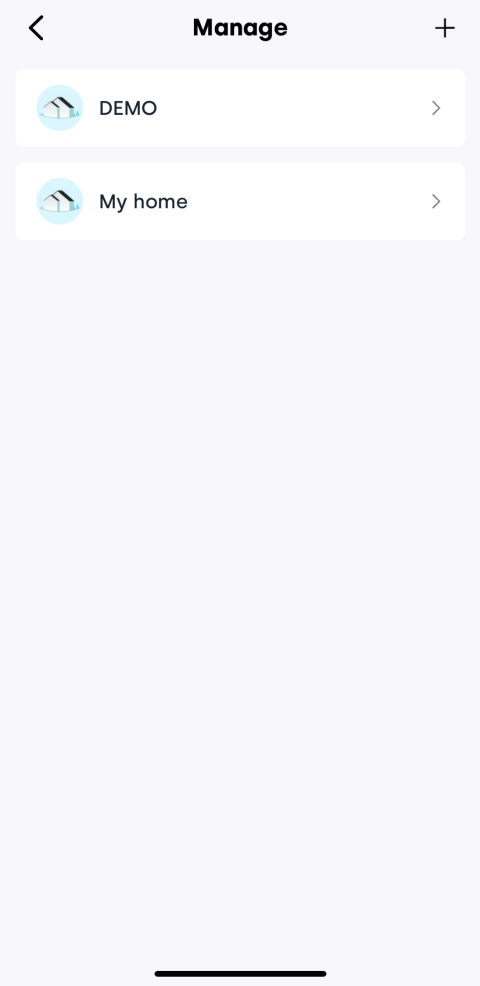
Tap Manage at the bottom of the home list to open the home management page.
Add a Home
- On the Home Management page, tap the + button in the upper-right corner.
- Follow the on-screen instructions to enter the home information.
For detailed instructions, see Add Home.
Edit or Delete a Home
On the Home Management page, select the home you want to manage. You can then:
2. Add a Device
Tap the + button in the upper-right corner of the Home page to start adding a device.
For detailed instructions, see Add Devices.
3. Weather
The weather card displays the current weather conditions and temperature at your home's location, helping you better understand how weather may affect energy production and consumption.
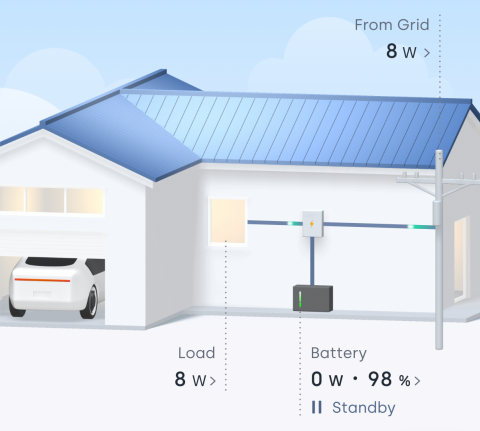
4. Power Flow
The Power Flow provides a real-time visual representation of where energy comes from and where it goes within your home. The direction of each animated flow indicates the actual direction of energy movement.
- Refresh data: Pull down on the Home page to refresh the latest data.
- Change the theme: To switch the Power Flow style, go to Dashboard configuration.
- Configure data sources: The data displayed in the Power Flow comes from your Data Source settings. Tap the corresponding field to configure it as needed.
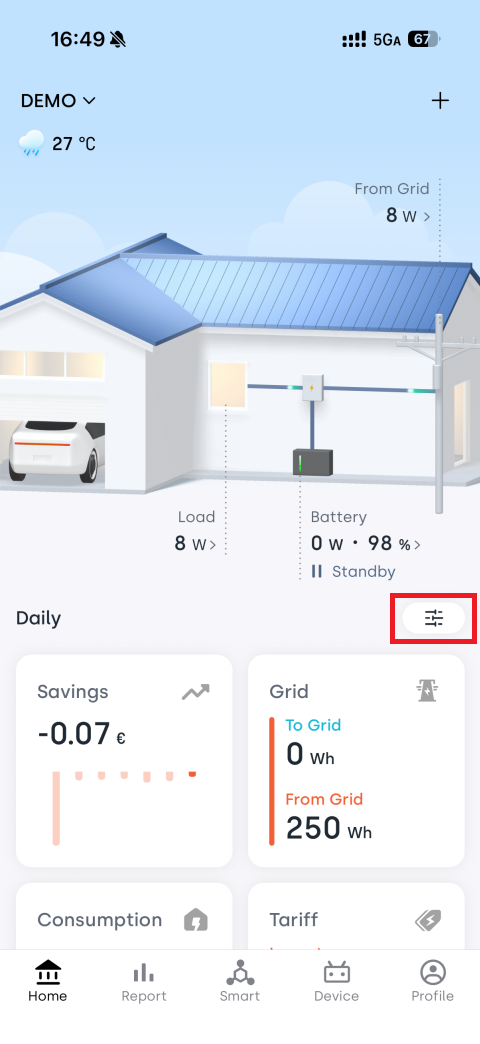
5. Dashboard
Tap ![]() to open the Dashboard configuration page and customize the content displayed on the Home page.
to open the Dashboard configuration page and customize the content displayed on the Home page.
You can:
- Choose an Power Flow theme
- Control which daily data cards are displayed
- Reorder data cards
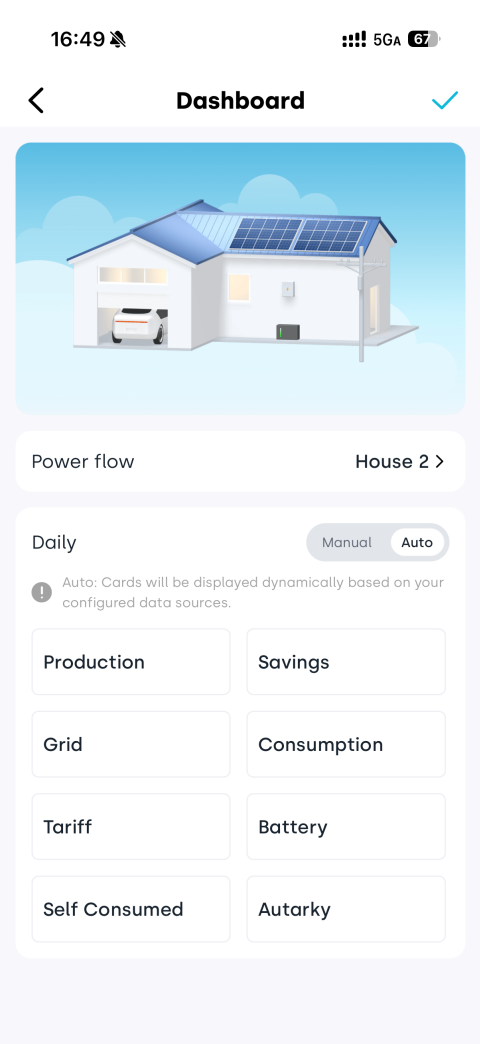
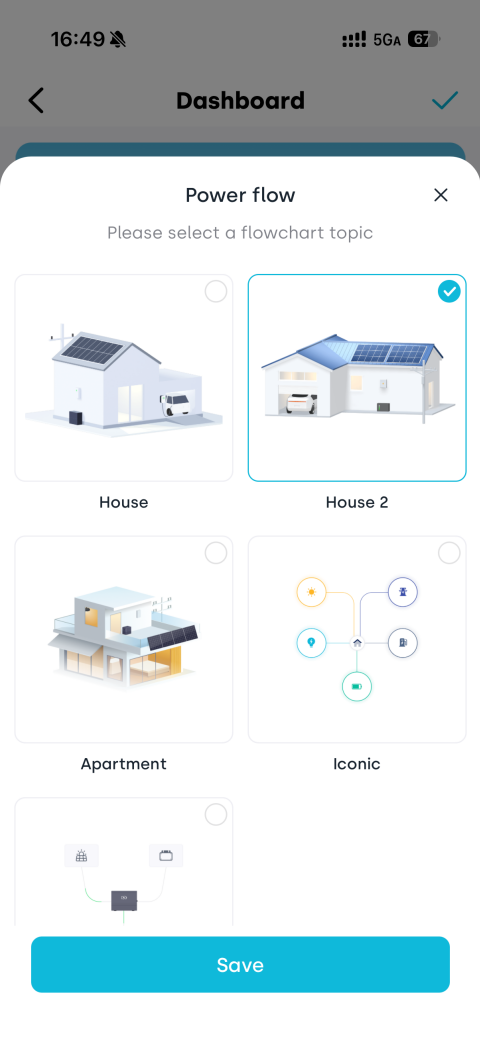
5.1 Power Flow Theme
Tap Power Flow to choose from different visualization themes.
5.2 Daily Data Display
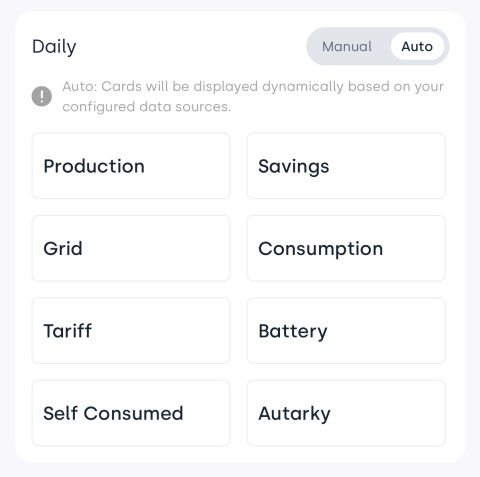
You can choose which Daily Data cards appear on the Home page.
Auto
The system automatically displays relevant data cards based on the currently configured data sources.
If a specific data source is not available, its corresponding card will not be shown.
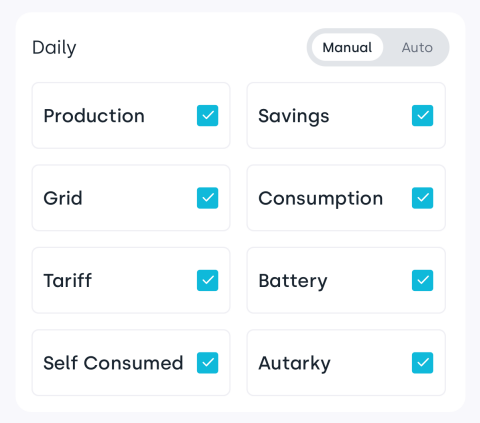
Manual
Manually select the data items you want to display.
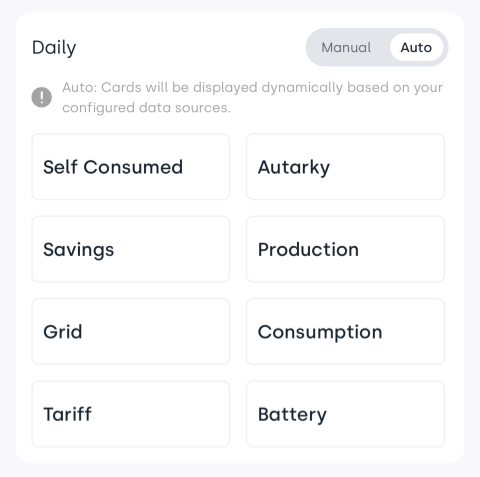
5.3 Reorder Data Cards
Press and hold a data card, then drag it to adjust its display order.
After reordering, the daily data section on the Home page will follow the new arrangement, making it easier to keep your most frequently viewed information at the top.
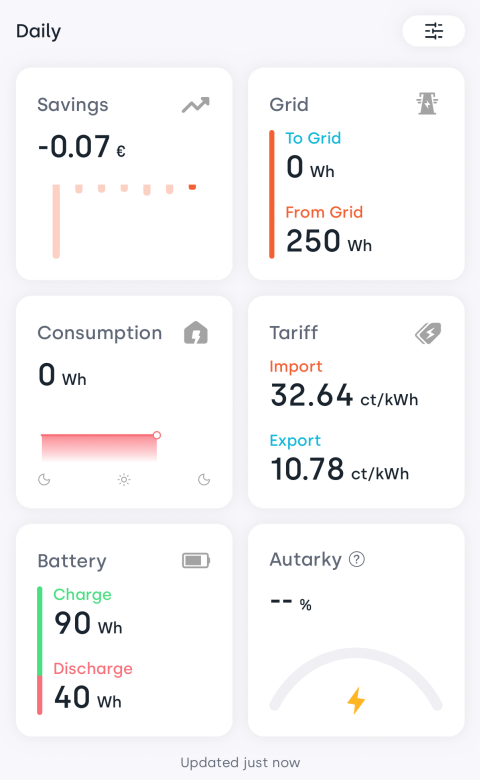
6. Daily Data
The Daily Data section summarizes your home's energy activity for the current day, helping you better understand energy production, consumption, and savings.
| Item | Description |
|---|---|
| Savings | Daily savings calculated based on the current electricity rates. Tap the Electricity Price card to view detailed earnings statistics. |
| Production | Total solar energy generated today. |
| Grid | Total energy imported from and exported to the grid today. |
| Consumption | Total household energy consumption today. |
| Tariff | The currently configured import and export electricity rates. |
| Battery | Total battery charge and discharge energy today. |
| Self-Consumed | (Solar energy used by household loads + solar energy used to charge the battery) ÷ total solar generation. Indicates how much of the generated solar energy is used within the home. |
| Autarky | (Energy consumed directly from solar generation + energy supplied by battery discharge) ÷ total household consumption. Indicates the percentage of household energy demand met by self-generated energy. |
You can customize which metrics are displayed in this section through Dashboard configuration.